New York's Overdose Map Was Drawn in 1938. It Still Holds.
A Boston Medical Center study found overdose death rates 86% higher in redlined neighborhoods. New York's maps show the same geography.
A team of researchers at Boston Medical Center took a federal map drawn in the 1930s — the one where government surveyors colored neighborhoods red and called them hazardous — and laid it over something that did not exist when the map was made: nine years of overdose death certificates.
The overlap was tight. In Massachusetts census tracts that received the lowest grade, annual opioid-related overdose death rates ran 86 percent higher than in the tracts that received the highest, even after the researchers adjusted for race and ethnicity, age and a standard measure of social vulnerability. The study, published November 4 in the Journal of Health Care for the Poor and Underserved, covered 326 tracts where 1,829 adults died of opioid overdoses between 2015 and 2019.
New York has never published that calculation for itself. It probably doesn't need to in order to guess the answer.
What the Massachusetts Numbers Actually Show
The grading system came from the Home Owners' Loan Corporation, a New Deal agency that sent surveyors into American cities to rate neighborhoods for mortgage risk. The best areas got an A and the color green. The worst got a D and the color red, a designation that followed Black and immigrant neighborhoods for decades afterward and helped starve them of lending.
Rebecca Smeltzer, a doctoral student at the University of Southern California, and her colleagues rebuilt those grades for Massachusetts tracts and compared them with overdose mortality. The gradient ran in a straight line:
| Historical HOLC grade | Difference in adjusted overdose death rate |
|---|---|
| A — "Best" | Reference group |
| B — "Still Desirable" | 53 percent higher |
| C — "Declining" | 61 percent higher |
| D — "Hazardous" | 86 percent higher |
"Where people live, the resources available to their communities and the lasting effects of historical disinvestment all matter," said Avik Chatterjee, an addiction specialist at Boston Medical Center and the study's senior author. Smeltzer put it more plainly: overdose risk "is influenced not only by individual factors, but also by longstanding structural inequities tied to place and community investment."
The researchers are careful about what this is not. It is an association, not proof of cause. The analysis only included tracts that had been mapped, which excluded most rural communities, and it covered a single state. But the relationship survived every control they applied, and it held in the same direction across all three lower grades.
New York Was Mapped Too
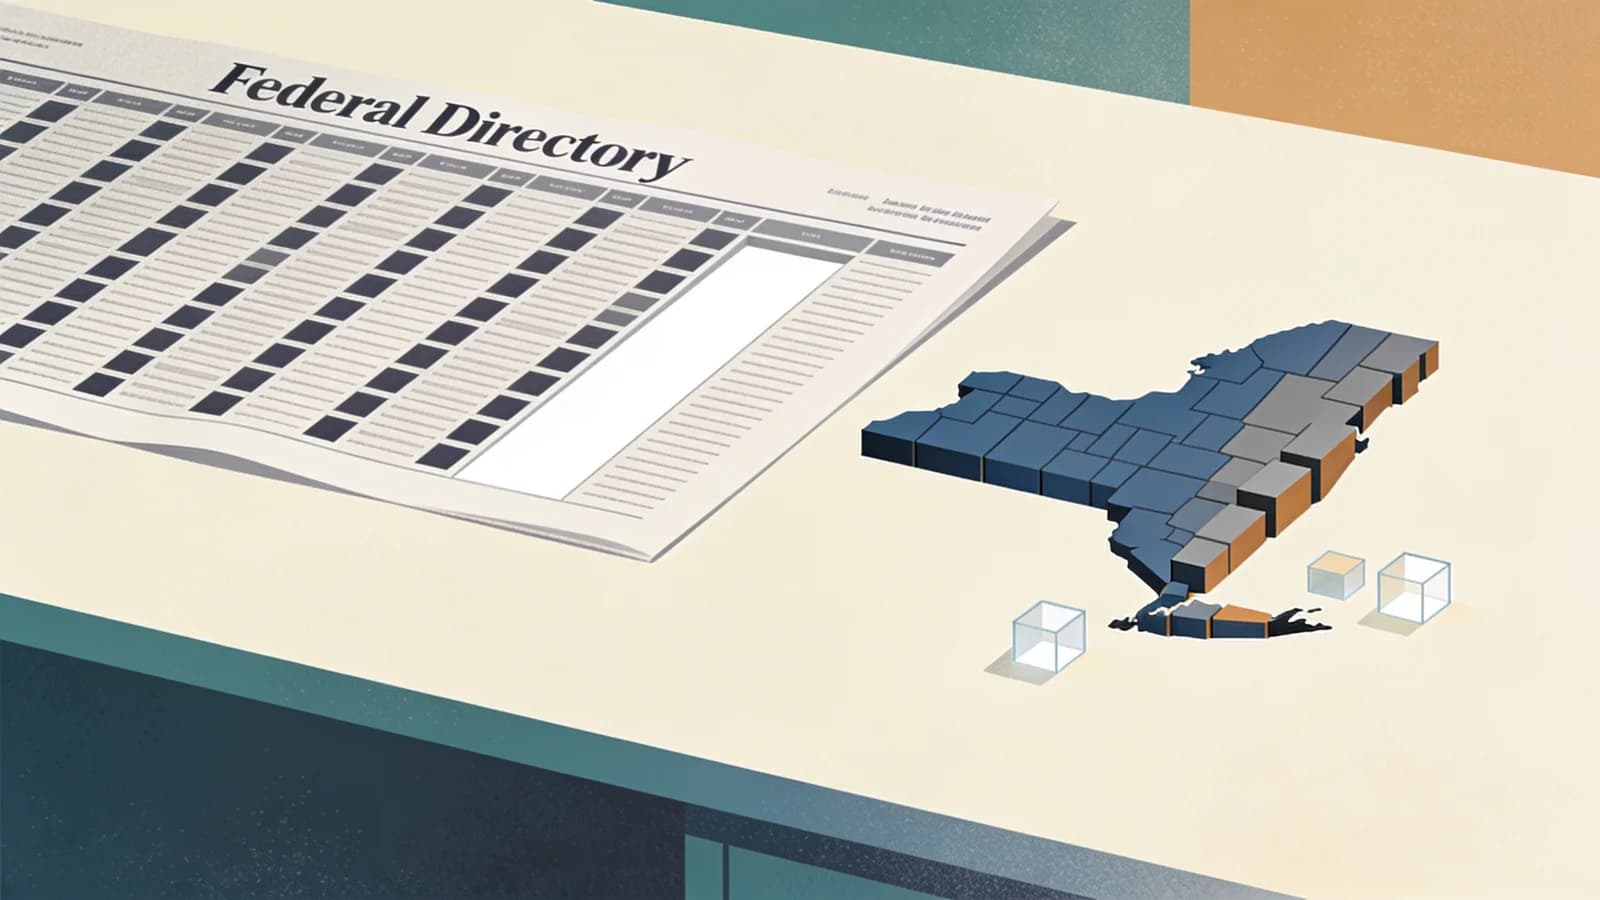
The Home Owners' Loan Corporation graded New York City in 1938. On the resulting map, a large stretch of the South Bronx was shaded red — Hunts Point, Mott Haven, Melrose, Morrisania — along with wide sections of central Brooklyn and upper Manhattan. The agency also produced maps for Buffalo, Rochester, Syracuse, Albany and other New York cities, all preserved in the Mapping Inequality archive at the University of Richmond.
The federal surveyors wrote explanatory notes for each red district. Those notes were about race, income and "infiltration" — the era's vocabulary for the arrival of Black and immigrant families — not about overdose risk, which had not yet been invented as a public health category.
Nearly ninety years on, the New York City neighborhoods the surveyors redlined are the neighborhoods the Health Department names when it publishes its worst numbers. In its 2021 overdose data, the city recorded 2,668 deaths, a 78 percent increase over 2019. The Bronx had the highest rate of any borough, and three Bronx districts — Hunts Point-Mott Haven, Crotona-Tremont and Highbridge-Morrisania — had the highest rates citywide. The city noted that these areas had ranked at the top since the fentanyl era began in 2016 and posted the largest increases that year.
The same report found overdose death rates among Black New Yorkers had more than doubled in two years, from 24 per 100,000 in 2019 to 53.5 per 100,000 in 2021.
A Better Year, Unevenly Shared
New York's numbers have since moved in the other direction, sharply. The state recorded an estimated 4,567 overdose deaths in 2024, down from 6,688 in 2023 — a 32 percent drop that Governor Hochul's office called historic, with about 77 percent of the deaths involving an opioid. Massachusetts saw a similar arc, with opioid deaths falling nearly 60 percent from 2022 to 2025 and dropping below 1,000 for the first time in more than a decade.
The Boston researchers chose Massachusetts partly because of that success. Their point is not that the decline is fake. It is that a statewide average can improve while the neighborhoods at the bottom of the old map stay at the bottom.
New York's own health commissioner made a version of that argument when the 2024 figures came out. "It's vital we continue to identify communities that are not experiencing these declines equally," said State Health Commissioner Dr. James McDonald. State Senator Nathalia Fernandez went further, noting that until the numbers are broken out by race, "it is unclear whether this decline is reaching all communities equally, especially Black and Brown New Yorkers."
That disaggregation is the missing piece in New York. The state publishes overdose data through an OASAS dashboard, and county-level figures are available, but no one has published the overlay that the Boston team produced: overdose deaths indexed to the 1930s grades.
Where the Geography Becomes Clinical
A map is not a mechanism. What turns a red line into a higher body count is more concrete, and New York's own comptroller has documented parts of it.
The 32 counties with no place to prescribe
In a review of the state's overdose data, the Office of the State Comptroller found that 32 of New York's 62 counties have no outpatient opioid treatment capacity at all, according to the OASAS provider directory. The counties that do have it are concentrated: the Bronx, with 10,015 treatment beds, has 703 beds per 100,000 residents, while entire regions have none. Manhattan and the Bronx, along with Chautauqua, Onondaga and Genesee counties upstate, carry the state's heaviest treatment capacity.
That distribution matters because medication for opioid use disorder — buprenorphine, methadone, naltrexone — is not a prescription a patient can fill at any pharmacy on short notice. Methadone in particular requires a licensed opioid treatment program, daily or near-daily attendance in many cases, and travel that assumes a car, bus fare and an hour that a working parent may not have. Transportation is the quiet filter on who stays in treatment.
Neighborhoods that were denied mortgage capital for decades also tend to have less pharmacy coverage, fewer prescribers accepting Medicaid, more housing instability and more frequent contact with the criminal legal system — each of which independently predicts a harder time starting and staying in care.
Three Billion Dollars, Allocated by County
New York is also in the middle of deciding where a great deal of money goes. The Attorney General's office has reached settlements totaling more than $3 billion with opioid manufacturers, distributors and retailers, most of it payable to communities over periods of up to 18 years for treatment, recovery and prevention. The state has made nearly $400 million in settlement funds available so far, which Hochul's office describes as more than any other state.
Under the settlement structure, a substantial share of that money is allocated by county governments through abatement plans, subject to state and national rules on allowable uses. That means the geographic question — which neighborhoods get the beds, the mobile units, the peer teams, the transportation vouchers — is being answered in county office buildings rather than in Albany.
The Massachusetts study is not a spending prescription. But Chatterjee draws a direct line from the finding to the funding decision: "Additional investment to redress historical disinvestment is an opportunity to help address overdose death risk in these neighborhoods." He points at housing, economic opportunity, health care access and community resources — the conditions that the red grade was originally a proxy for.
What Would Count as Proof
The honest version of this story is that nobody has run the New York numbers. A Massachusetts study of 326 tracts cannot tell New York where its next overdose cluster will be, and the researchers explicitly warn against reading their work as evidence that redlining caused these deaths.
What it can do is supply a hypothesis that New York is unusually well equipped to test. The state has the historical maps, preserved and public. It has mortality data going back decades, down to census tract in many cases. It has a comptroller who has already published county-level treatment capacity gaps, and an addiction agency that publishes an overdose dashboard.
If the pattern holds here the way it held in Massachusetts, the policy implication is uncomfortable but simple: a system that allocates treatment by county and measures success by a statewide decline can report progress while the neighborhoods that were redlined in 1938 remain exactly where they were — first in line for overdose deaths, last in line for care.
If you or someone you know is struggling with substance use, New York's HOPEline operates 24 hours a day at 1-877-846-7369, or text HOPENY (467369). Treatment options across the state are listed through the OASAS website.
Written by
MTNYC Editorial TeamThe MTNYC Editorial Team is a group of healthcare writers, researchers, and addiction specialists dedicated to providing accurate, compassionate, and evidence-based information about addiction treatment and recovery resources in New York State.